How to Use Breakpoints in Xcode

Welcome!
Welcome to a new series, Xcode Tips & Tricks! In this series, I'll give you some quick tips and tricks to make working with Xcode even easier. If you haven't already, be sure to download Xcode from the Mac App Store so you can follow along.
For this post, we will be discussing breakpoints and how you can use them during your time using Xcode. Breakpoints are a debugging tool that let you interrupt your program while it is still running. Pausing the execution of your code can be helpful to diagnose issues that you may be experiencing in your app. Let's take a look at how to do this in a real project. For this example, I'll be using the Contacts App that we built in the Contacts App Series. Be sure to check out that series so you understand what we'll be doing here. Let's get started!
Adding Breakpoints
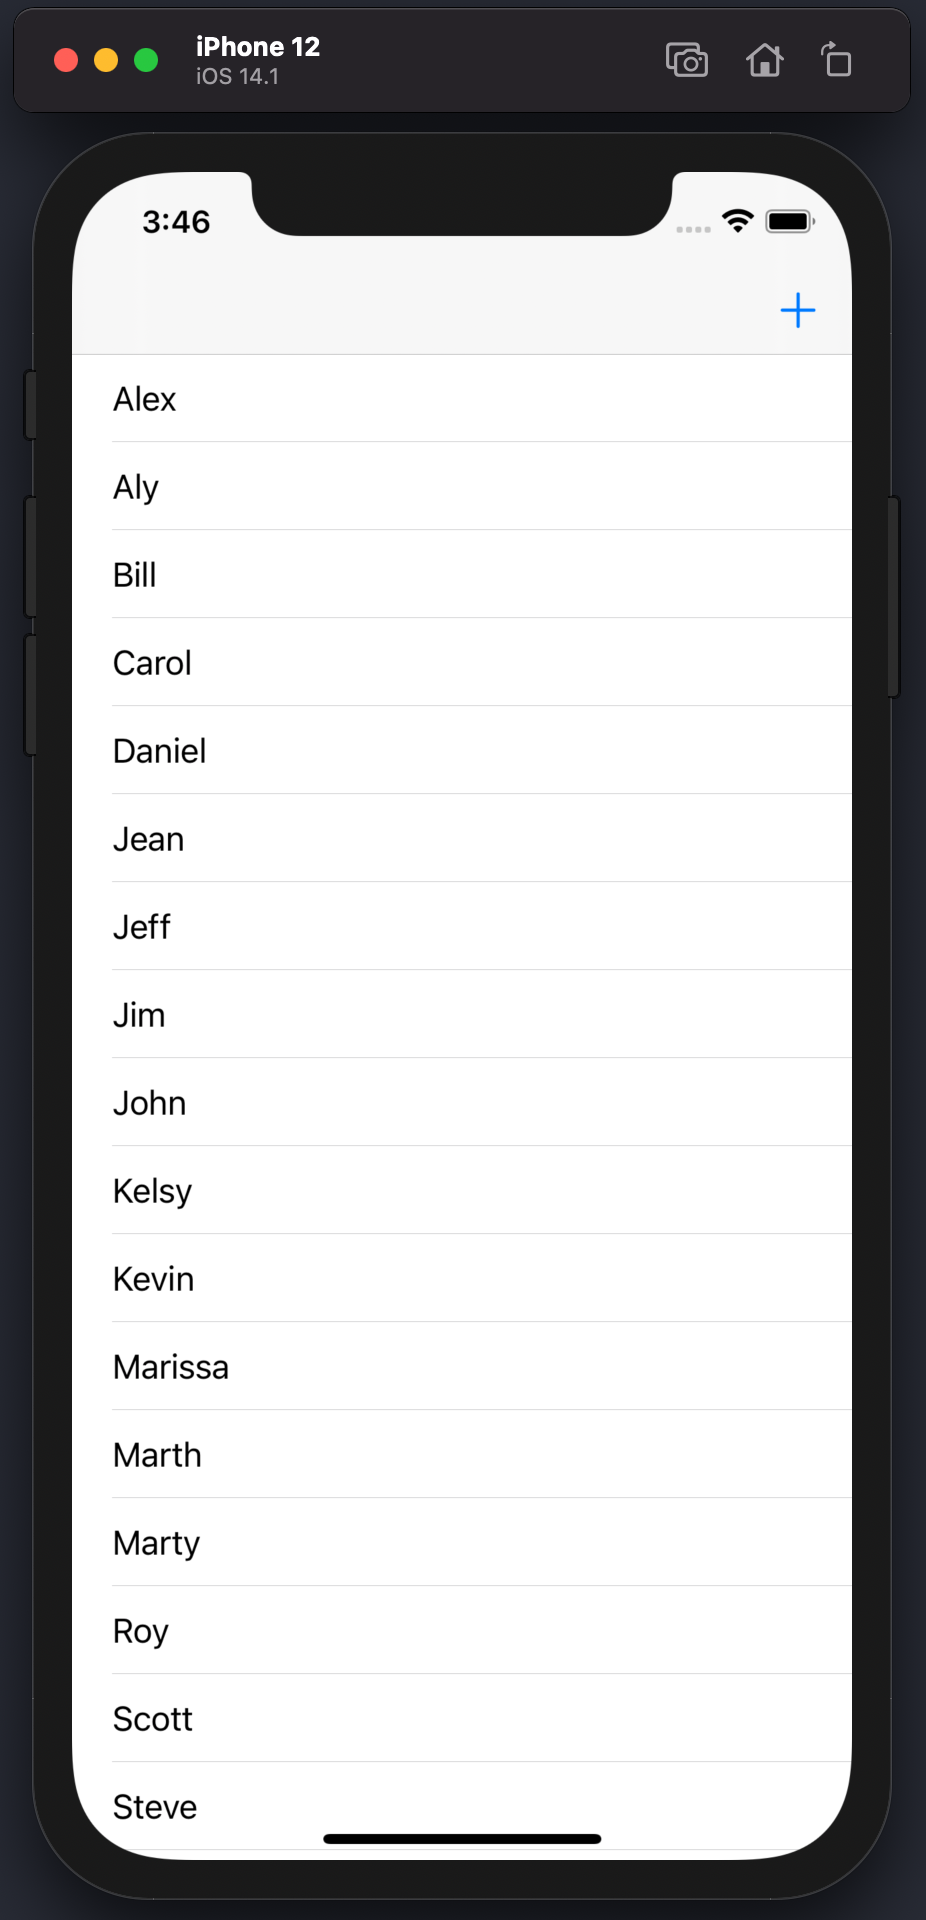
Go ahead and open up your Contacts App project. Just a quick refresher, we created this simple app to store a list of contacts. You can add or delete the contacts you create. Your app should look something like this:
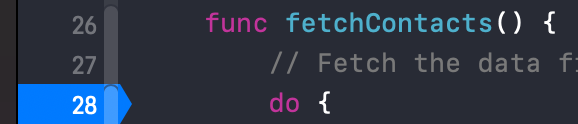
Now, say we had an issue where our records were not getting properly updated. Open up the ViewController.swift file and navigate to the viewDidLoad() method. In that method, you should see a line that says fetchContacts(). Go ahead and delete that line of code. Run the app and you should see that something isn't working now, and that's exactly what we wanted. The app isn't showing any of our contacts! What might you do to start to figure out the problem? This is where breakpoints can come in handy to help you diagnose problems just like this. Our first thought might be there's an issue with the fetchContacts() method, so, go ahead and click the line number of the line that has do {. You should see a blue chevron appear to the left of your code, like so:
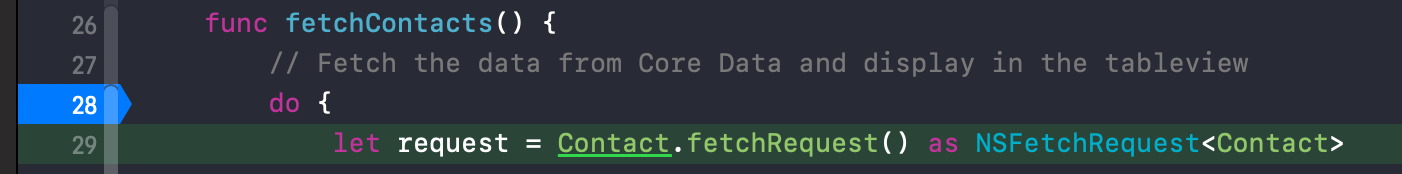
This view indicates that you have now created a breakpoint. What I want you to do now is rerun your app and click on the + and create a new contact. Hit the Save button and see what happens. Woah! We just hit our breakpoint. You should see something like this:
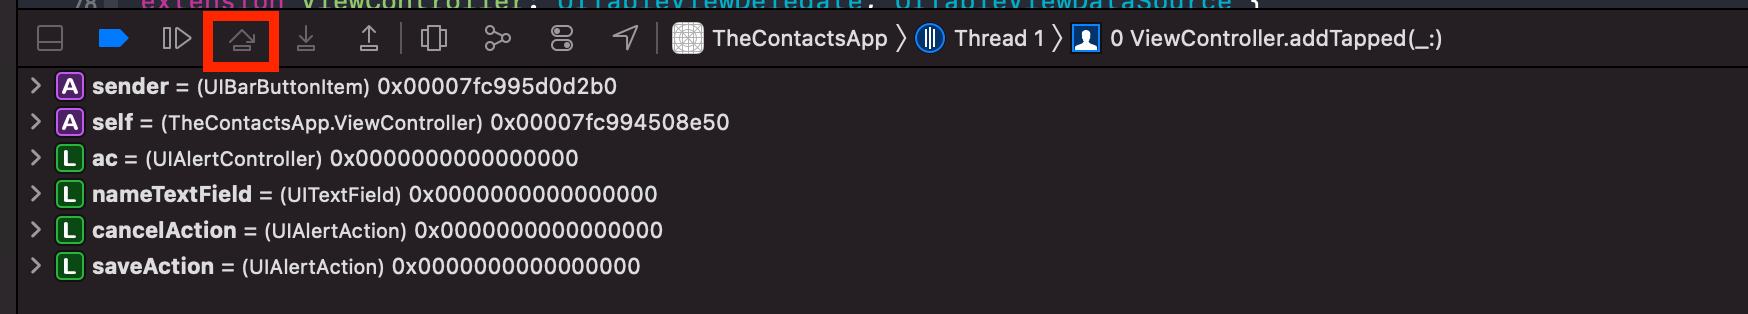
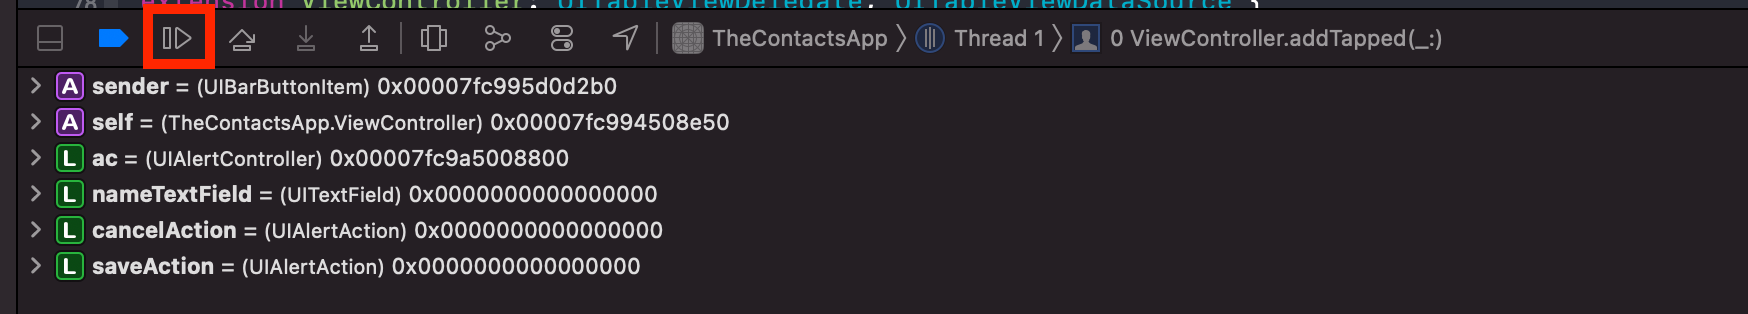
This is exactly what we wanted to occur. Now that we have paused execution, we can step over our lines of code and see what is being executed line-by-line. Click the following button highlighted in red, right above the Debug area:
You should see that your code has moved to the next line. You can execute lines of code one-by-one using this step over button. Now, if you're ready to resume the execution of your app and don't want to keep clicking the step over button, you can click the button directly to the left of the step over, which is the continue button:
After you hit the continue button, you should see that all of our contacts appear in the tableView. That's weird, huh? So our contacts aren't showing up when we first run the app, but they do once we hit the Save button.
The fetchContacts() method should be called every time we want to get our contact list. So it's reasonable to believe that if we use a breakpoint within that method, we expect our code to pause execution immediately upon loading and after every time a contact is added. Since we already saw that we aren't hitting our breakpoint when the app loads, we know there must be something wrong with our viewDidLoad(). Would you look at that? We aren't calling our fetchContacts()! Go ahead and re-add fetchContacts() at the end of the viewDidLoad() method. Now if you run the app again, you should immediately see that execution is paused.
Utilizing the Console
In the Debug Area of Xcode, you should have noticed when you hit your breakpoints that you have a debug window at the bottom. This debug window is the Console. In this view, you can check the values of objects that your app has created. A very simple way to do this is to use the po call. Run your app, and step through your code until you reach the } catch { line. Then enter po contacts in the console and hit enter. You should see something like this:
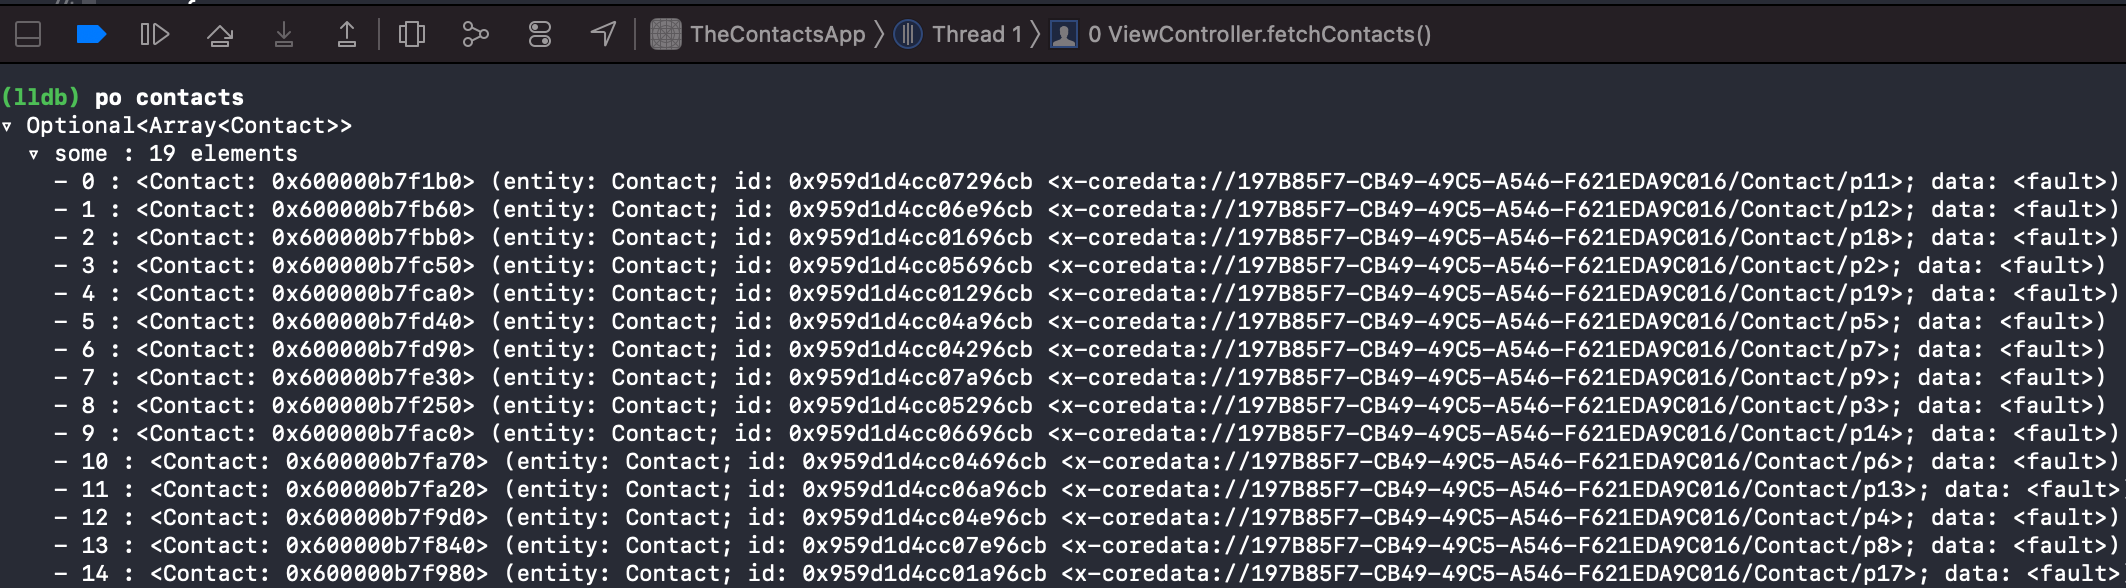
What we just did was print out our contacts variable using the po command. We can see that our contacts app contains many elements (19 in my case) that have been created. If you were to run the app again and not step through the code at all before printing out the contacts, you would see that it is nil. This is easy enough to explain. Our contacts haven't been retrieved and populated yet. It isn't until the self.contacts = try context.fetch(request) line is executed that we have any data in our contacts.
Remember to utilize the console while you're using breakpoints. The console can explain why something might not be working. If you're working with optionals and you expect a value to be populated, but it isn't, it's likely because that optional value is still nil. You can verify that by using breakpoints and the console.
Disabling and Removing Breakpoints
Once you've finished diagnosing your problems using a breakpoint, you can disable and remove them. To disable a breakpoint, simply click on the chevron. You should see that the breakpoint goes from a bright blue to a more dull blue. Rerun your project to verify you aren't hitting any breakpoint.
To remove a breakpoint, simply drag-and-drop the chevron off the line number. You should now not see any blue chevrons over the line numbers.
Alternatively, you may be in a project that has many breakpoints and you don't feel like disabling or deleting breakpoints one-by-one. Xcode has a solution for this and it's a dedicated tab for breakpoints. Select the Breakpoint Navigator in the upper left of the Xcode editor and you should see the following:
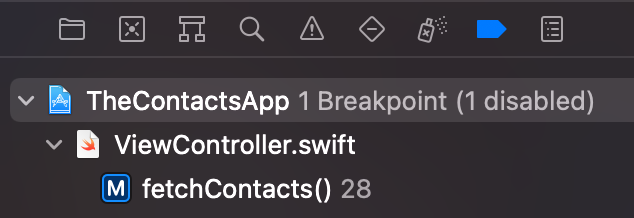
This view indicates all of the breakpoints, the status of the breakpoints, and where the breakpoints are located in each file. If you right-click on the project name, you will see a drop-down menu with the options related to breakpoints:
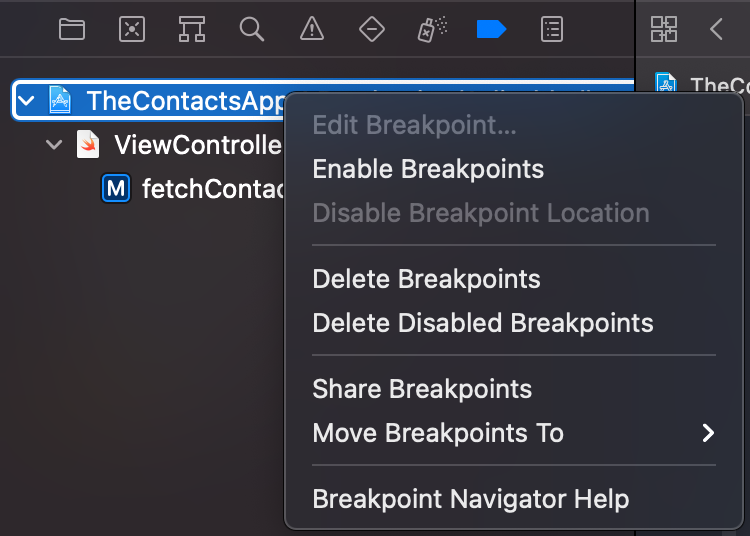
Using the Breakpoint Navigator you can enable, disable, and delete your breakpoints, all from one location.
Wrap Up
And that's all there is to it! Breakpoints are a simple and easy way to pause the execution of your code and walk through it step-by-step. Now, it takes a bit of intuition to use breakpoints effectively. You need to have a good sense of what should be happening in your application and where the issues might be. The more you develop apps, the better your intuition will become and the easier time you will have choosing where you need to add breakpoints. Keep practicing and I promise it'll get easier.
Happy coding!


